
Understanding Ratio Analysis: A Comprehensive Guide
- Victor Vita

- Jul 25, 2023
- 5 min read
Updated: Jul 28, 2023
Ratio analysis is a powerful technique used by financial professionals to assess the financial health and performance of a company. By comparing the relationship between different financial data points, ratio analysis provides valuable insights into various aspects of a company's operations. Whether you are an investor, a manager, or a business owner, understanding ratio analysis is crucial for making informed decisions and evaluating the financial viability of a company.
In this comprehensive guide, we will delve into the world of ratio analysis, exploring its key components, interpretation, and limitations. We will cover the main areas where ratio analysis is applied, the key financial ratios used in each area, and the significance of these ratios in assessing a company's liquidity, coverage, solvency, profitability, efficiency, and market prospects.

Unlock Your Financial Potential - Enroll Now in 'Learn to Invest' Course! Empower yourself with expert knowledge, master investment strategies, and pave your way to financial success. Don't miss out on this life-changing opportunity. Join us today and embark on a journey towards a prosperous future!
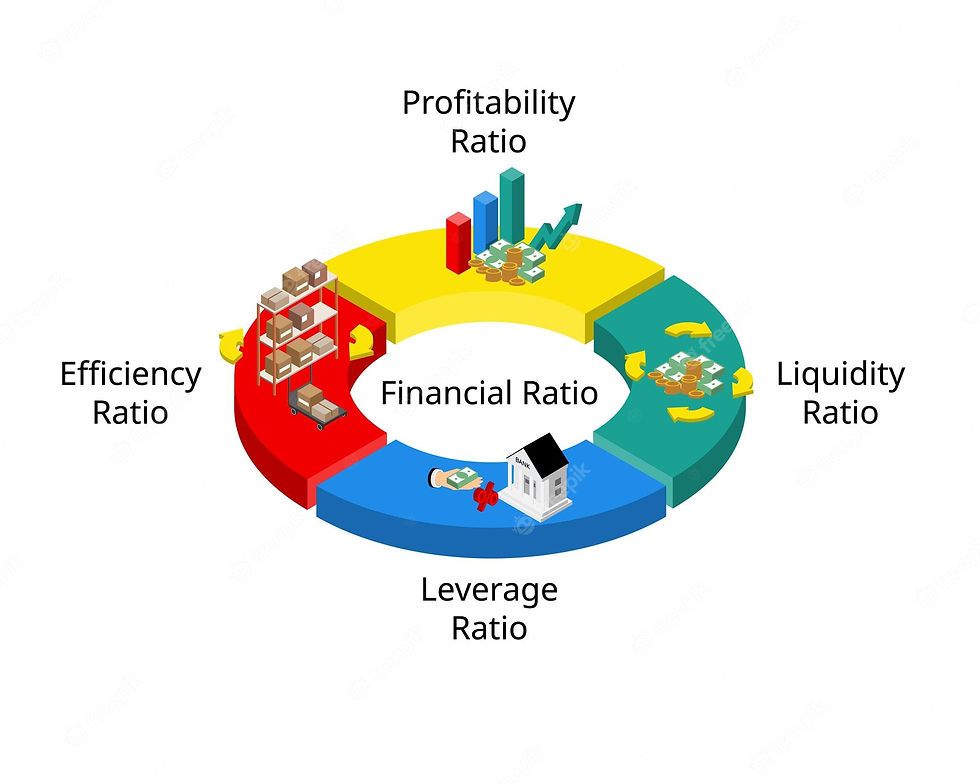
Understanding Financial Ratio Analysis
Financial ratio analysis involves the comparison of different financial data points from a company's financial statements. It enables us to make fair comparisons across time and between different companies or industries. However, it is important to note that financial ratios can only be interpreted fairly if the financial statements are prepared according to the same set of accounting standards. This ensures consistency and accuracy in the underlying data.
Liquidity Analysis
Liquidity analysis focuses on a company's ability to meet its immediate debt obligations out of its current assets. Two key financial ratios used to assess liquidity are the current ratio and the quick ratio.
The current ratio, also known as the working capital ratio, is calculated by dividing current assets by current liabilities. It provides an indication of a company's short-term liquidity position. A higher current ratio indicates a greater ability to meet short-term obligations.
On the other hand, the quick ratio, also known as the acid test ratio, is a more stringent measure of liquidity. It excludes inventory from current assets as inventory may not be easily converted to cash. The quick ratio is calculated by dividing current assets minus inventory by current liabilities.
Coverage Analysis
Coverage analysis evaluates a company's ability to pay interest, fees, and charges on its debts, without considering the underlying capital obligations. The two key financial ratios used in coverage analysis are the times-interest-earned ratio and the debt-service-coverage ratio.
The times-interest-earned ratio is calculated by dividing earnings before interest and taxes by interest expense. It measures a company's ability to cover its interest payments with its earnings. A higher ratio indicates a greater ability to service its interest obligations.
The debt-service-coverage ratio, on the other hand, is calculated by dividing net operating income by total debt service charges. It provides an assessment of a company's ability to meet its debt obligations, including both interest and principal payments.
Solvency Analysis
Solvency analysis focuses on a company's ability to pay off all its debts with its income, assets, or equity. The two key financial ratios used in solvency analysis are the total-debt ratio and the debt-to-equity ratio.
The total-debt ratio is calculated by dividing total liabilities by total assets. It provides an indication of the proportion of a company's assets that are financed by debt. A higher total-debt ratio may indicate a higher risk of insolvency.
The debt-to-equity ratio, on the other hand, is calculated by dividing total liabilities by total assets minus total liabilities. It measures the proportion of a company's financing that comes from debt compared to equity. A higher debt-to-equity ratio may indicate higher financial leverage and risk.
Profitability Analysis
Profitability analysis assesses a company's ability to generate profits from its goods or services. It involves analyzing various financial ratios, including the net profit margin, return on total assets, basic earning power, and return on equity.
The net profit margin is calculated by dividing net income by sales. It measures the percentage of each dollar of sales that is converted into profit. A higher net profit margin indicates better profitability.
The return on total assets is calculated by dividing net income by total assets. It measures the return generated by a company's total investment in assets. A higher return on total assets indicates better profitability.
The basic earning power ratio is calculated by dividing earnings before interest and taxes by total assets. It measures a company's ability to generate operating income from its total assets. A higher ratio indicates better earning power.
The return on equity is calculated by dividing net income by common equity. It measures the return generated for shareholders' equity. A higher return on equity indicates better profitability for shareholders.
Efficiency Analysis
Efficiency analysis focuses on how efficiently a company utilizes its assets to generate revenue. It involves analyzing various financial ratios, including the inventory turnover ratio, days-sales outstanding, fixed-assets turnover ratio, and total-assets turnover ratio.
The inventory turnover ratio is calculated by dividing sales by inventory. It measures how quickly a company sells its inventory. A higher ratio indicates better efficiency in managing inventory.
Days-sales outstanding, also known as the average collection period, is calculated by dividing accounts receivable by average sales per day. It measures the average number of days it takes for a company to collect its accounts receivable. A lower number of days indicates better efficiency in collecting receivables.
The fixed-assets turnover ratio is calculated by dividing sales by net fixed assets. It measures how efficiently a company utilizes its fixed assets to generate sales. A higher ratio indicates better efficiency in utilizing fixed assets.
The total-assets turnover ratio is calculated by dividing sales by total assets. It measures how efficiently a company utilizes all its assets to generate sales. A higher ratio indicates better overall asset utilization.
Market Prospects Analysis
Market prospects analysis is primarily used for publicly traded companies and helps determine the likely prospects of different investment options. It involves analyzing various financial ratios, including the price-earnings ratio, price-cash-flow ratio, market-book ratio, dividend yield, earnings per share, and dividend-payout ratio.
The price-earnings ratio is calculated by dividing the stock price per share by earnings per share. It provides an indication of how the market values a company's earnings. A higher ratio may indicate higher growth expectations.
The price-cash-flow ratio is calculated by dividing the stock price by cash flow per share. It measures the market's valuation of a company's cash flow. A lower ratio may indicate a better value investment.
The market-book ratio is calculated by dividing the stock price by the book value per share. It measures the market's valuation of a company's assets. A higher ratio may indicate a higher growth potential.
The dividend yield is calculated by dividing the dividend by the share price. It measures the return on investment from dividends. A higher dividend yield may indicate a higher return for shareholders.
Earnings per share are calculated by dividing the profit by the number of outstanding shares. It measures the earnings attributable to each share. Higher earnings per share indicate better profitability for shareholders.
The dividend-payout ratio is calculated by dividing the dividend per share by earnings per share or dividends by net income. It measures the proportion of earnings paid out as dividends. A higher ratio may indicate a higher dividend payout.
Limitations of Ratio Analysis
While ratio analysis is a valuable tool for assessing a company's financial health, it has certain limitations. It is a quantitative analysis that does not consider qualitative factors such as the quality of management or market conditions. Therefore, it only provides a partial picture of a company's prospects and should be used in conjunction with other analysis methods.
Conclusion
Ratio analysis is an essential tool for assessing a company's financial health and performance. By analyzing various financial ratios, we can gain valuable insights into a company's liquidity, coverage, solvency, profitability, efficiency, and market prospects. However, it is important to consider the limitations of ratio analysis and complement it with a holistic assessment of a company's operations and external factors. By understanding ratio analysis and its applications, you can make more informed decisions and evaluate the financial viability of a company.


Comments